Modeling small molecule PK: Midazolam - Part 1
Hello and welcome! 👋
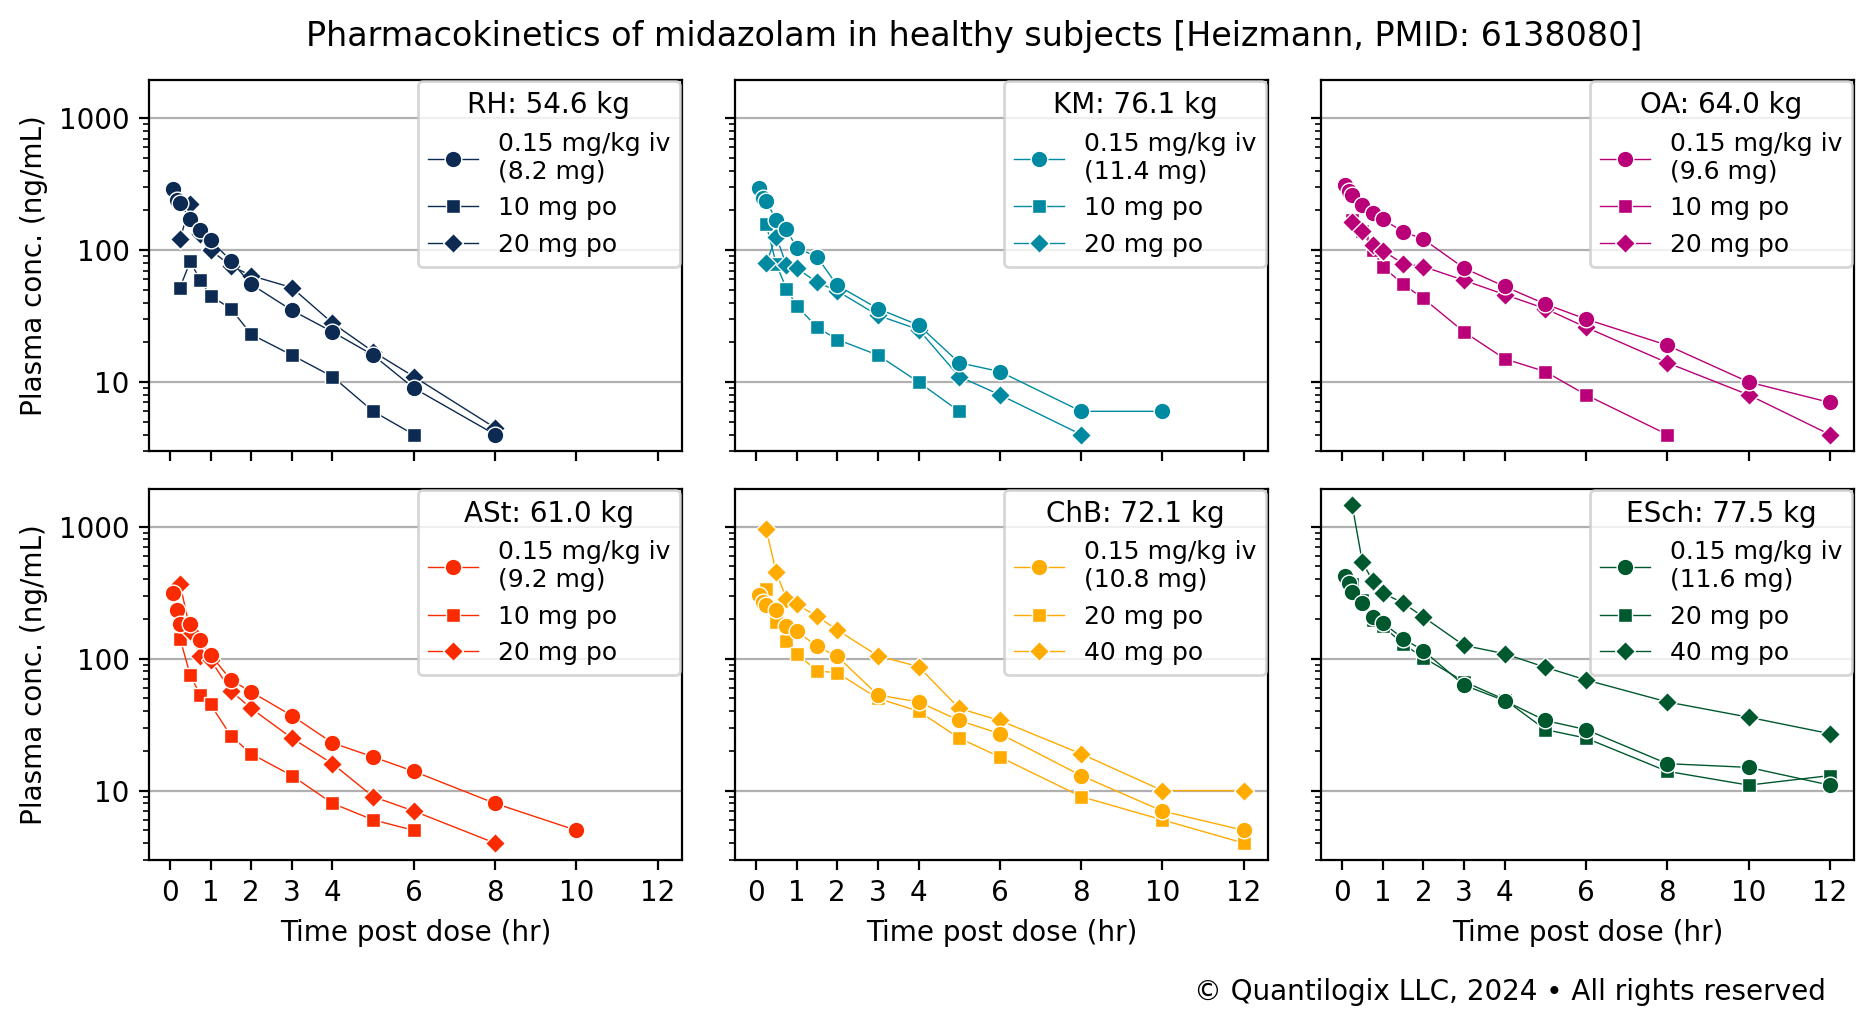
This is the first post about modeling small molecule pharmacokinetics (PK) using published human time course data for midazolam plasma PK (Fig. 1).
Background
Midazolam is a fast-acting benzodiazepine drug used as an anaesthetic and sedative. It is a small organic molecule (MW = 326 g/mol) that is rapidly absorbed and metabolized by the body. Midazolam PK in healthy humans was reported by Heizmann et al in the publication “Pharmacokinetics and bioavailability of midazolam in man” (PMID: 6138080).
Study design
This study used six healthy volunteers who were given midazolam either intravenously (iv, 0.15 mg/kg) or orally (po, 10, 20 or 40 mg). Plasma concentration of midazolam, and its primary metabolite alpha-hydroxy-midazolam were measured at various times after dosing. The following table shows the overall study design:
| Subject | 0.15 mg/kg iv | 10 mg po | 20 mg po | 40 mg po |
|---|---|---|---|---|
| R.H. | • | • | • | |
| K.M. | • | • | • | |
| O.A. | • | • | • | |
| A.St. | • | • | • | |
| Ch.B. | • | • | • | |
| E.Sch. | • | • | • |
Data aggregation and plotting
The plots in Fig. 2 show different views of the same data with subjects grouped into cohorts. Fig. 2A plots the individual subject time traces. These plots show the inter-subject variability within these data. Fig. 2B shows the estimated median concentration and a 95% credible interval (CI) of the median estimated using a bootstrap resampling scheme. Fig. 2C shows both the median ± CI and the individual observations at each time point. Note how for the 40 mg po cohort with n = 2 subjects, the median CI is the entire of the data.
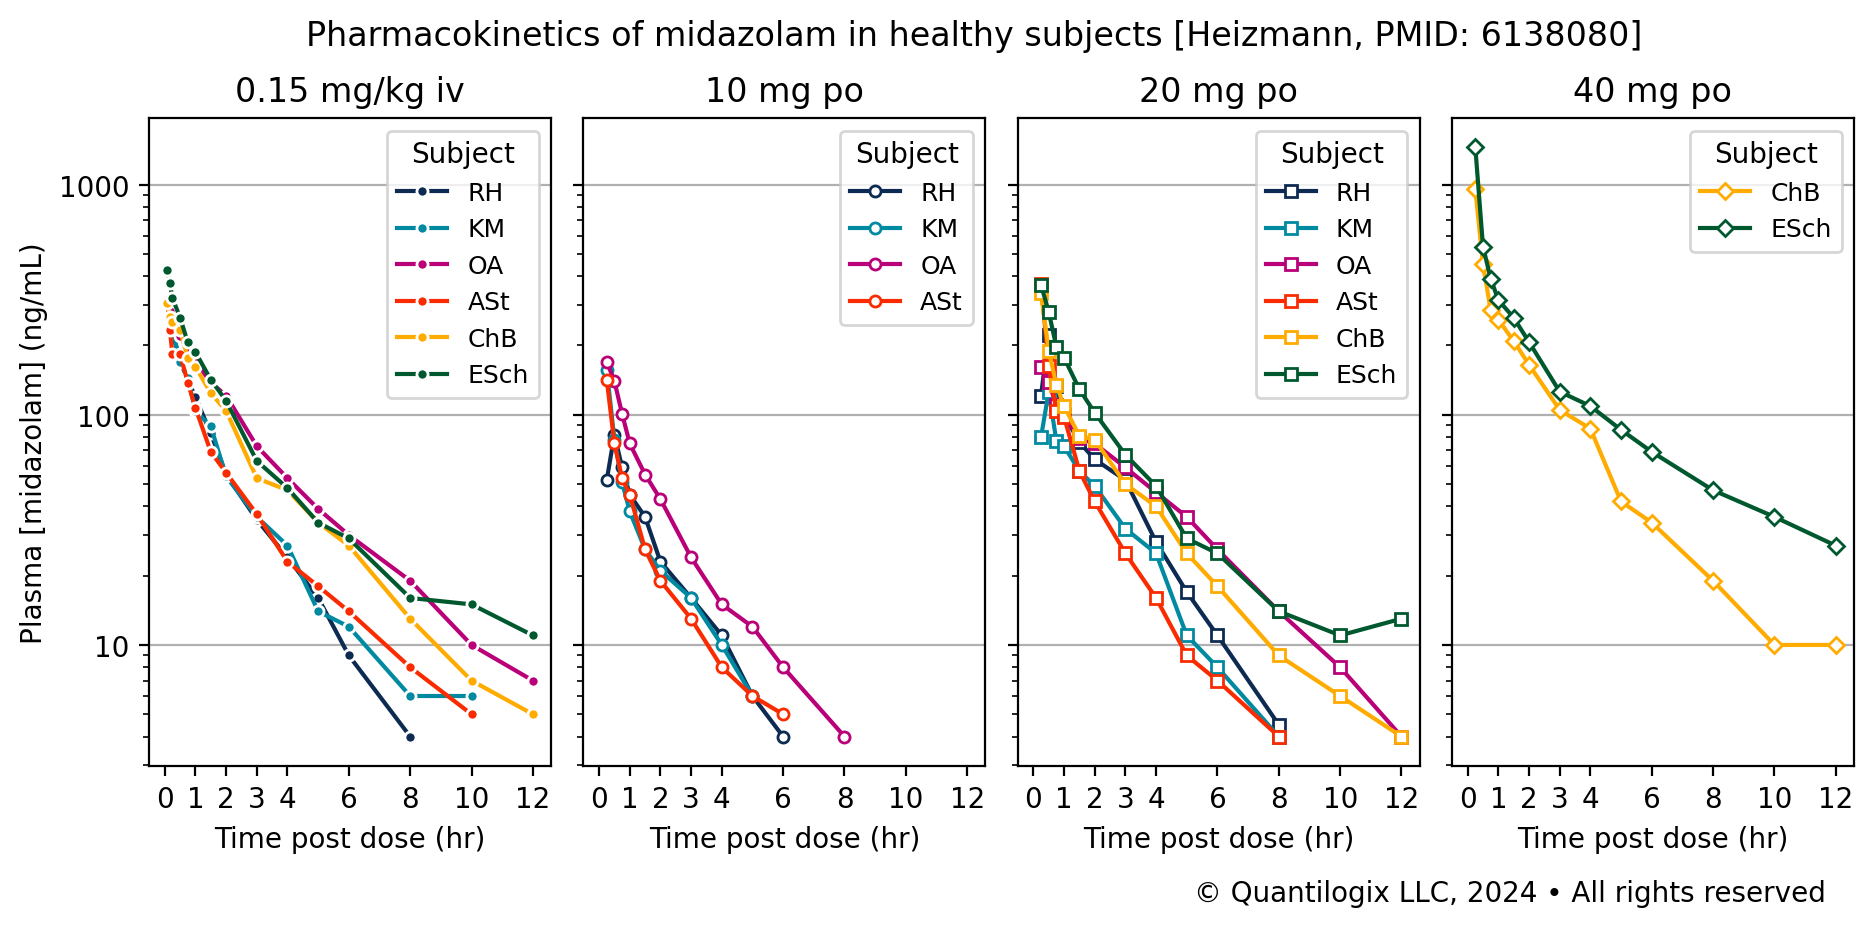
Figure 2A: Plasma PK of midazolam after a 0.15 mg/kg iv or 10, 20 or 40 mg oral dose. Time traces show plasma concentrtion of midazolam for individual subjects.
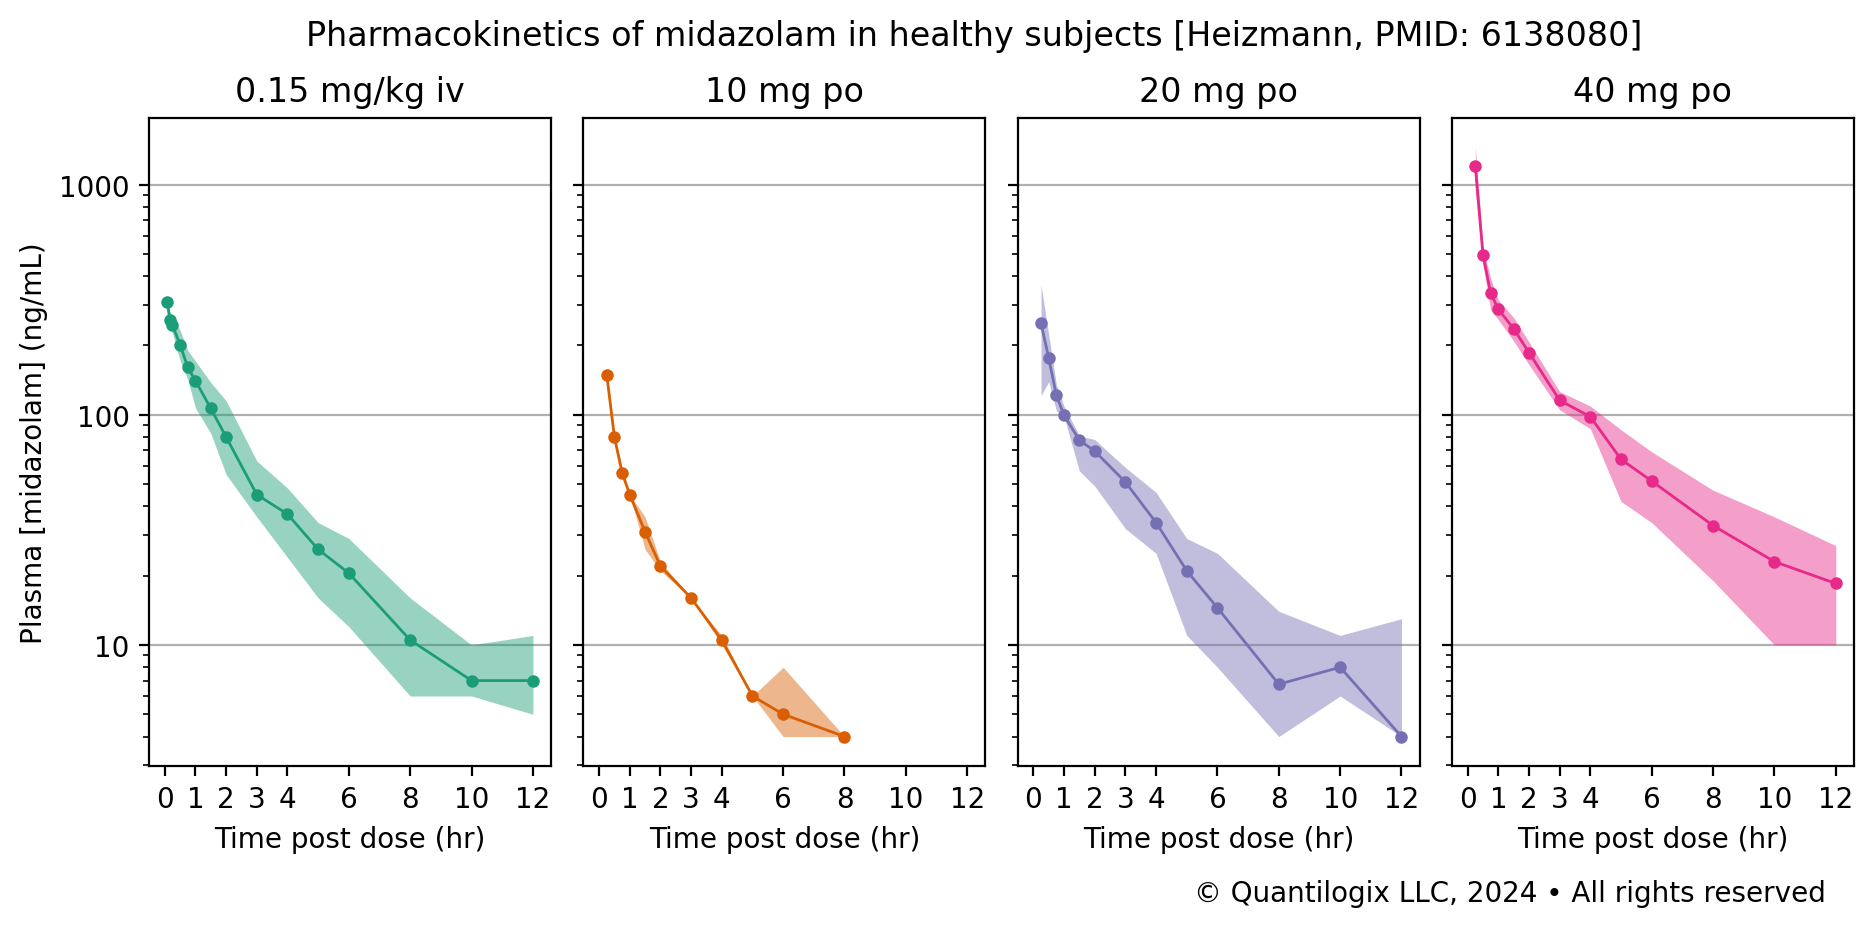
Figure 2B: Median plasma concentration of midazolam for each cohort ± 95% credible interval estimated from individual observations at each time point.
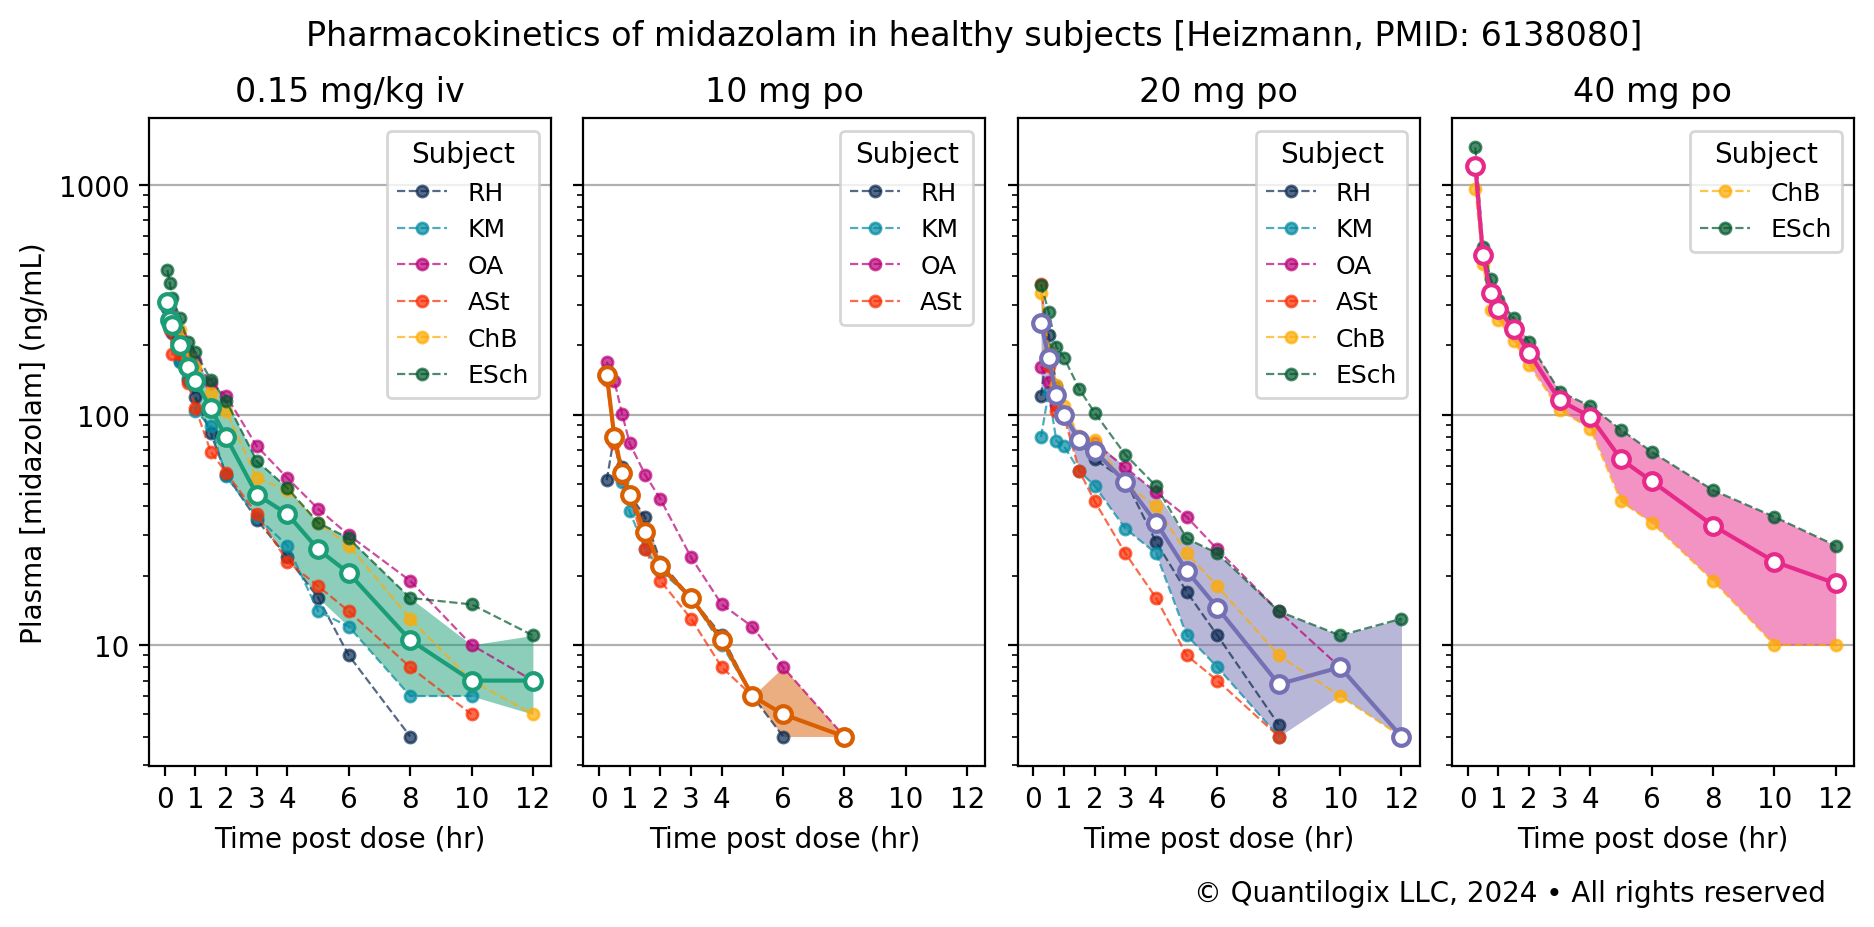
Figure 2C: Median ± 95% CI of midazolam plasma concentration for each cohort overlaid with individual observations at each time point.
Summary
This post introduces midazolam plasma PK data reported by Heizmann et al, summarizes the study design used in this study, and plots individual subject PK time traces and aggregated time courses with estimated medians and CI.
NEXT: To quantify midazolam exposure, one can run a non-compartmental analysis (NCA) or a compartmental analysis (CA) on these data. These analyses and their outputs are described in the next posts in this series.
Thank you for reading! 👋